
Empowering Venture Capital Decisions With Microsoft Dynamics-Powered Dashboards
At CyberMedics, we understand the complexities Venture Capital (VC) and Private Equity (PE) firms face in managing diverse portfolios.
You need the right data at the right time—whether it’s a high-level partner evaluating returns or an analyst diving deep into customer trends. That’s why we specialize in creating custom dashboards that seamlessly integrate Microsoft Dynamics with Microsoft Power BI, giving every stakeholder the insights they need to succeed.
With tailored dashboards, firms can consolidate and visualize performance data from their portfolio companies, turning raw data into actionable insights. Whether tracking revenue metrics, cash flow indicators, or customer analytics, our solutions empower firms to identify trends, make data-driven decisions, and maximize returns.
Custom Dashboards for Every Role
Every team member in a VC firm has unique needs. CyberMedics’ dashboards are designed with flexibility in mind, ensuring that each user can track the metrics most relevant to their role:
Partners and Executives: High-level dashboards focused on return metrics like IRR, ROI, and DPI, providing a clear picture of portfolio performance.
Portfolio Managers: Tools to monitor revenue growth, cash flow health, and operational efficiency across multiple companies.
Analysts and Associates: Granular views of customer analytics, CAC-to-LTV ratios, and churn trends to uncover opportunities and risks.
Custom Dashboards for Every Role
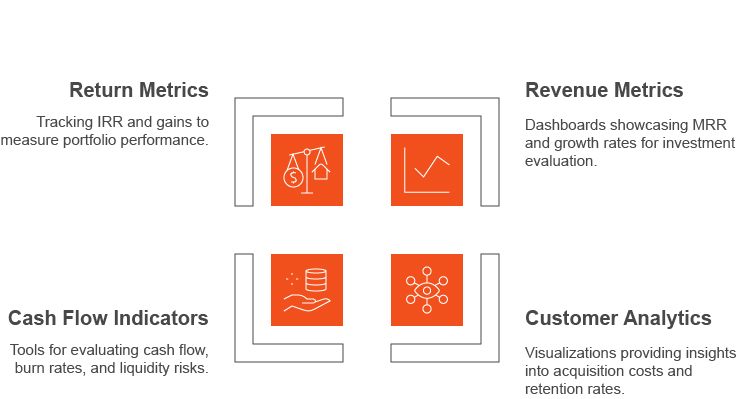
Revenue Metrics: Dashboards built to showcase metrics like Monthly Recurring Revenue (MRR) and growth rates, allowing firms to identify high-performing investments and evaluate revenue stability.
Customer Analytics: Visualizations that provide insights into customer acquisition costs, retention rates, and demographic breakdowns, enabling sharper market strategies.
Cash Flow Indicators: Tools to evaluate operating cash flow, burn rates, and liquidity risks, helping firms manage cash effectively and predict capital requirements.
Return Metrics: Detailed tracking of IRR, realized vs. unrealized gains, and distribution metrics to measure portfolio performance over time.
How CyberMedics Optimizes Decision-Making
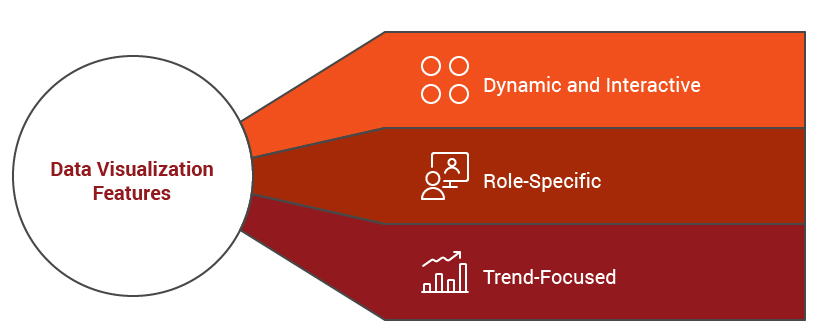
We go beyond simply visualizing data—we help firms extract actionable insights. By integrating Power BI with Microsoft Dynamics, we create dashboards that are:
Dynamic and Interactive: Users can drill down into specific metrics, compare year-over-year, month-over-month, or week-over-week performance, filter by company, region, or product line.
Role-Specific: Tailored views for different teams ensure everyone has the information they need at their fingertips, prioritized and sorted to each individuals preference.
Trend-Focused: Highlighting rolling averages, growth trajectories, and benchmarks to support strategic decision-making.
Why Choose CyberMedics?